Last year, the Dutch Association for data & marketing (DDMA) and the Global Data & Marketing Alliance (GDMA) joined forces with local DMAs and Email Service Providers (ESPs) across the world to create the very-first . Recently, the DDMA and GDMA hosted a roundtable session for all partners to discuss the results of this study and the next steps for the upcoming, second edition of the benchmark. In this article, we shed light on the most important highlights of this discussion.
Note: this study provided an international representation of the email industry, with partners and ESPs from Latin America, Canada/North America, France, Belgium and the Netherlands.
Legal rules, hygiene maturity and deliverability determine Acceptance Rates & Hard Bounce Rates
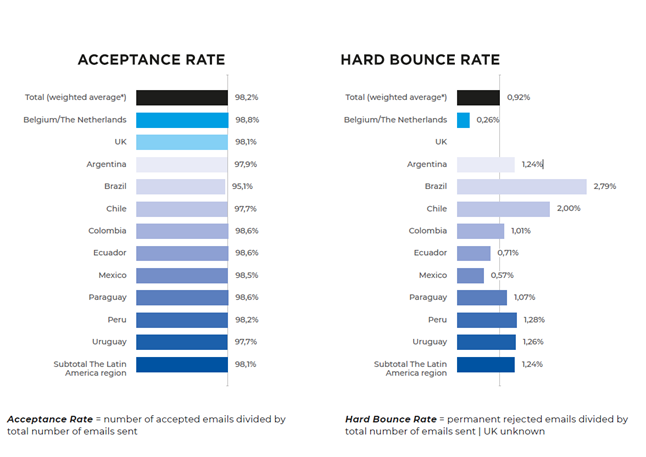
The overall Acceptance Rate (AR) is 98,2%, and Hard Bounce Rate (HBR) 0,92%. ESPs in the Netherlands/Belgium achieve rates above average (AR: 98,8%, HBR: 0,26%), while the UK scores on average (AR: 98,1%, HBR: unknown) and there are significant differences between the Latin America region.
With regards to the Acceptance Rate, Brazil scores significantly lower (95,1%), where some counties like Paraguay and Columbia have a positive 98,6% AR. Brazil (2,79%) and Chili (2,00%) have a remarkable high Hard Bounce Rate, compared to other countries in the Latin American region, like Mexico (0,57%) or Ecuador (0,71%).
The difference between the Netherlands/Belgium and the other countries can be explained by legal rules, list hygiene maturity, for example by using several feedback-loops, and best practices in deliverability. In some countries in the Latin American region, Hard Bounces are not directly excluded for future sending. In the Netherlands and Canada/North America, the legal rules are strict and not following them would potentially result in an economic or cultural risk.

Data maturity and strategy affect Unique Confirmed Open Rate and Unique Click Through Rate
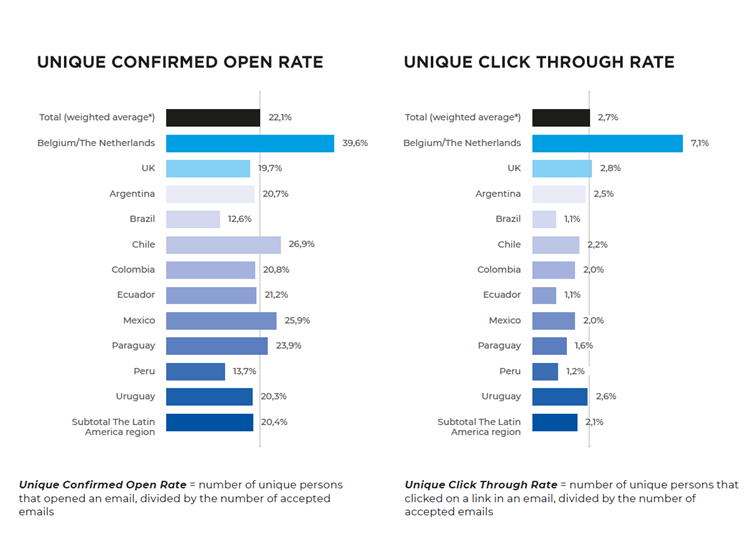
The total average of Unique Confirmed Opens (COR) is 22,1% and Unique Click Through Rate (CTR) 2,7%. We can see again significant differences between the Netherlands/Belgium (COR: 39,6%, CTR: 7,1%), the UK (COR: 19,7%, CTR 2,8%) and the subtotal of the Latin American countries (COR 20,4%, CTR 2,1%). If we look at the differences between the Latin American countries, Brazil (COR: 12,6%, CTR: 1,1%) and Peru (COR: 13,7%, CTR: 1,2%) score significantly lower than the rest, like Chili (26,9%) and Mexico (25,9%) with much higher open rates, and in Argentina (2,5%) and Uruguay (2,6%) with much better Click Through Rates.
The Apple Mail Privacy Protection was introduced in September 2021 – the study is based on 2021 data, and affects the open rates, and to a certain extent the open rate data. A logical hypothesis is the higher adoption rate of iOS in the Netherlands/Belgium compared to the Latin American countries. Moreover, the maturity and different strategies of email marketing also affect the differences in engagement (like open rates and clicks). For example, a strategy of sending newsletters, service/loyalty e-mails and triggered/event based campaigns, creates a much higher engagement than one-off, blast sell campaigns.

Retail/e-commerce and non-profit industries outperform all other industries regarding Unique Click Trough Rate
Of all industries available, retail/e-commerce (3,7%) and the non-profit industry (4,3%) are the best performing industries in terms of Unique Click Through Rate (CTR total average is 2,7%). Travel (1,9%) scores the lowest CTR.
If we look at the Latin American region specifically, there are some remarkable outcomes which could not be explained directly in the discussion. Such as, a very high CTR in Peru (10,5%) in the business service industry, where it might be more difficult to differentiate specific industries.
Most email campaigns were sent in Q4 and at the end of the office week
In general, most campaigns were globally sent in Q4, with Q1 coming in last. This can be explained due to events like Black Friday, public holidays and end of year actions. Advertisers usually invest in Q1 for planning and hit off again in Q2.
Again, for all countries in the study, most email campaigns were sent at the end of the office week: 18% of all campaigns on both Thursdays and Fridays. The least popular is the weekend, with 14% being sent throughout the weekend.
However, if we look at the engagement, weekend sending in some countries score better than during office days. For example, in the Netherlands and in Belgium the CTR is actually highest on emails sent on Saturdays (8,3%) and in Paraguay the open rate is highest on Sundays (26,5%). Of course, the business line (B2B/B2C) is a factor which could be affecting the differences as well.
Next steps: second edition of the GDMA International Email Benchmark
The roundtable discussion was also an opportunity to brainstorm on the this year’s 2023-publication and how it can be made even better and more valuable to the industry. First, the objective is to transfer from a static whitepaper to an interactive dashboard in which marketers can dive deeper for specific metrics for their own purposes. For example, to filter on industry, business line and scope. Furthermore, the ambition is of course to extend the benchmark to more countries and ESPs.
There is still time for ESPs to join the 2023 International Email Benchmark. We are looking for ESPs to join this international effort to:
- Help map the email marketing channel on a global scale
- Benchmark your data & clients’ campaigns to others around the world
- Provide an even-bigger independent baseline measurement for any organization using email marketing to compare their metrics
- Contact us & join the global email benchmark: rdewouters@fedma.org
Authors:
- Jasper Kolwijck, Lead Email & Messaging Team at KPN and DDMA committee member Email
- Nanda Appelman, Market Insights Specialist at DDMA
Final editors:
- Bob Younge, Content Specialist at DDMA
- Robin de Wouters, Communication & Commercial Director at GDMA
